View temperatures and charts
Sign in with the same credentials as the web app. At the bottom of the screen, four tabs: Home, Sensors, History, Settings.
Home
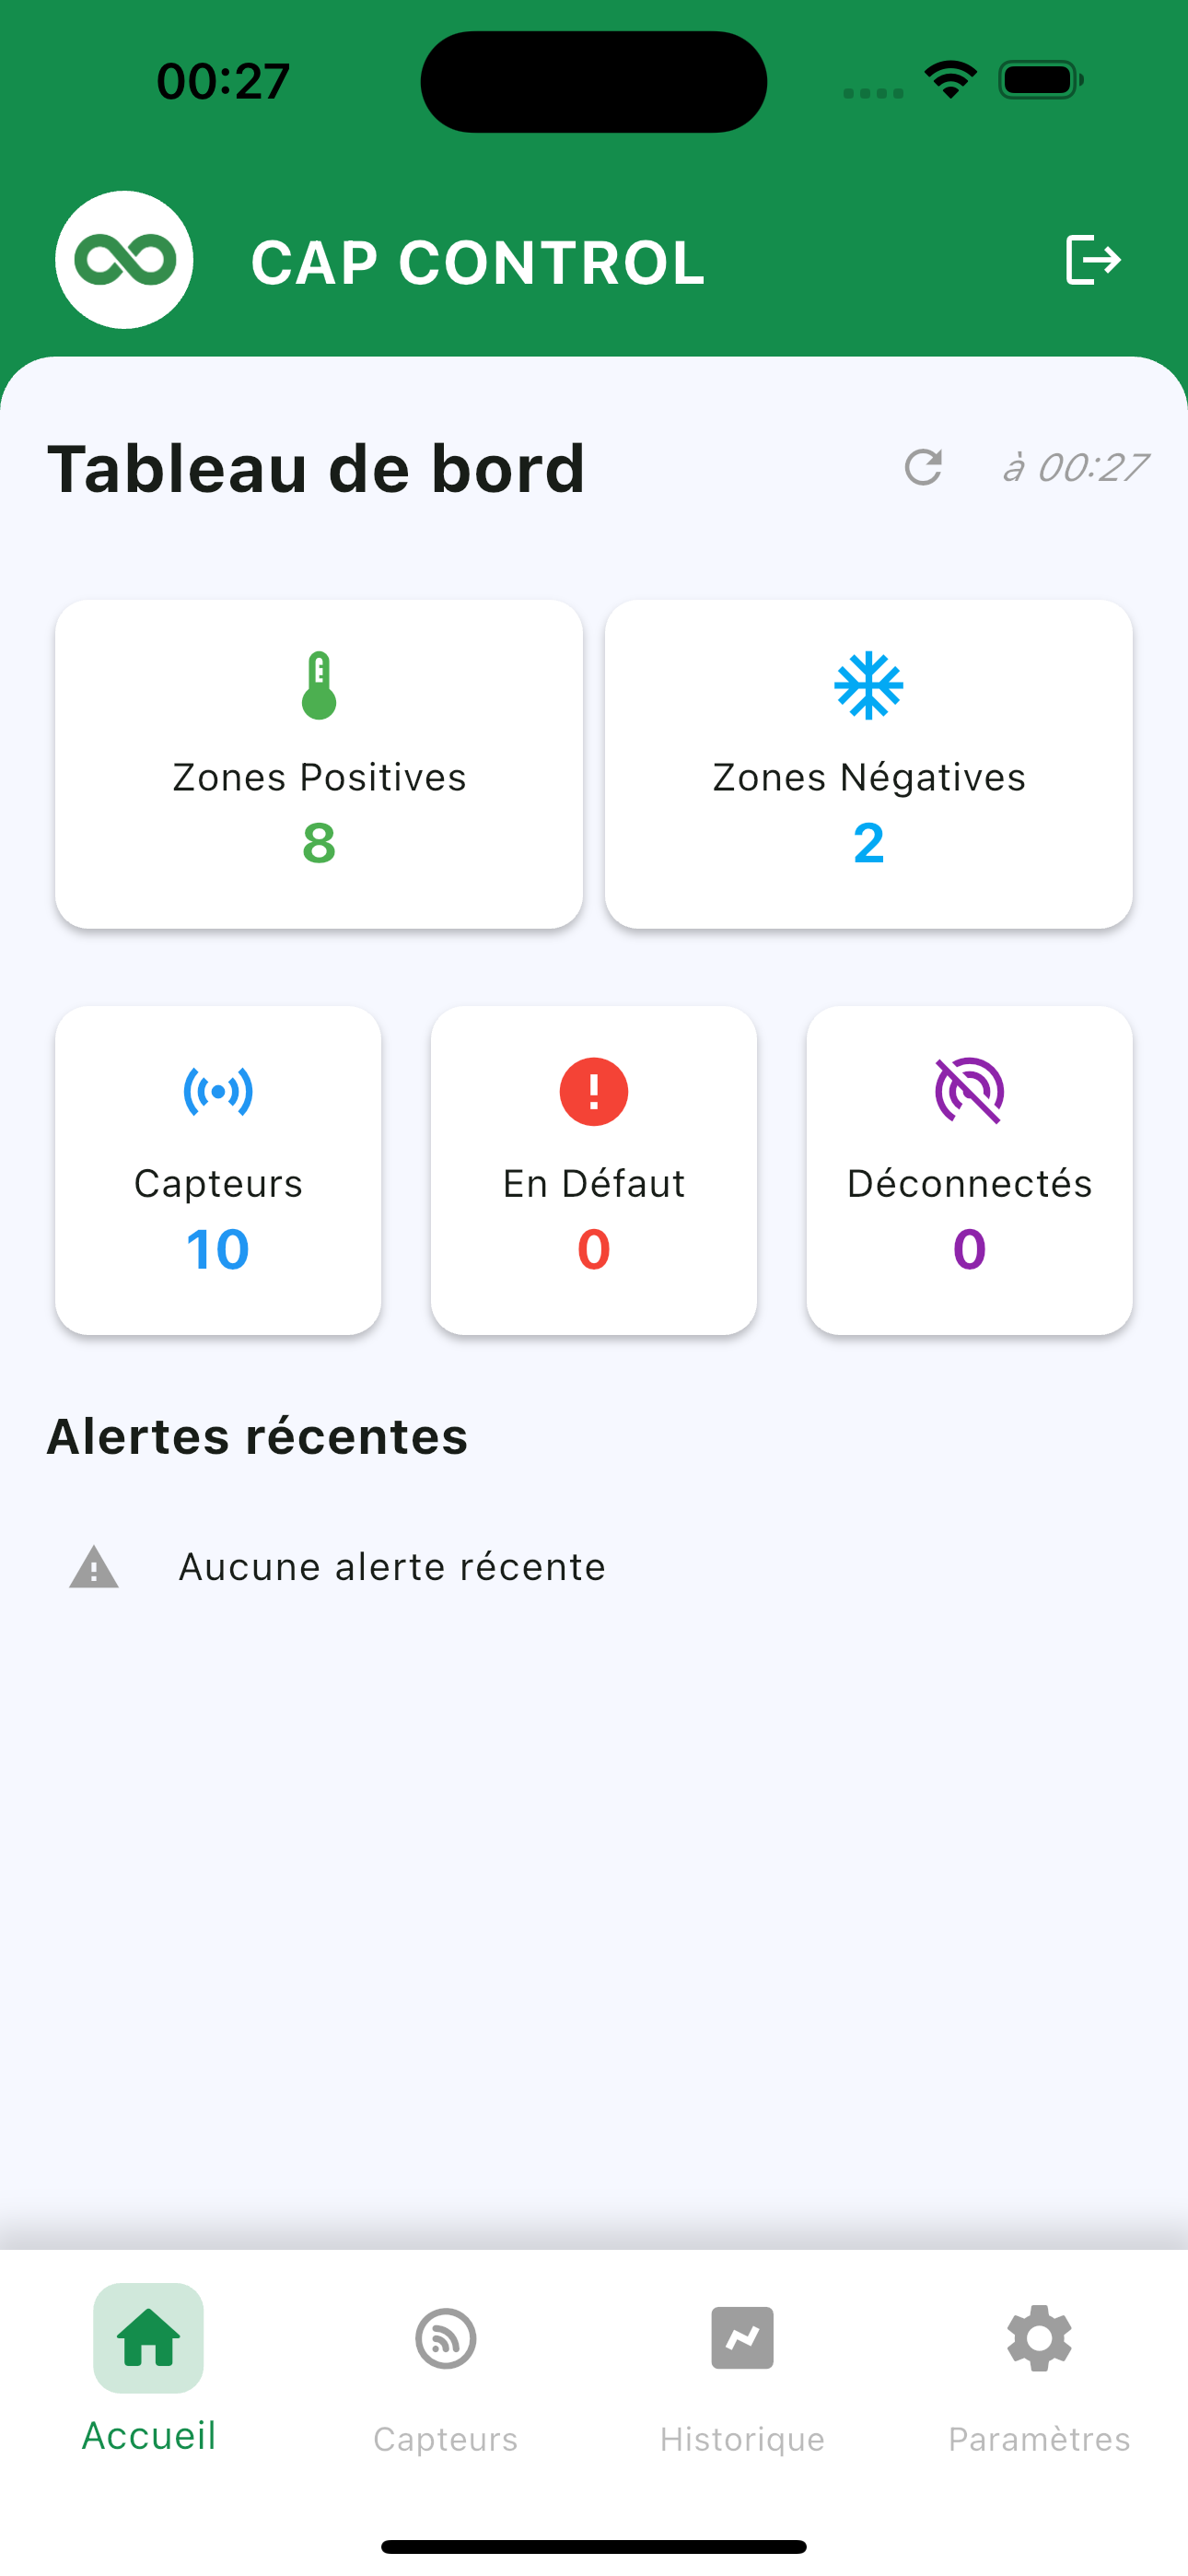
The dashboard summarises the fleet:
- Positive zones / Negative zones: number of monitored units;
- Sensors: total;
- In fault: out of range;
- Disconnected: no recent reading;
- Recent alerts: latest alerts, or “No recent alerts”.
The time next to the refresh icon is the last update.
Sensors
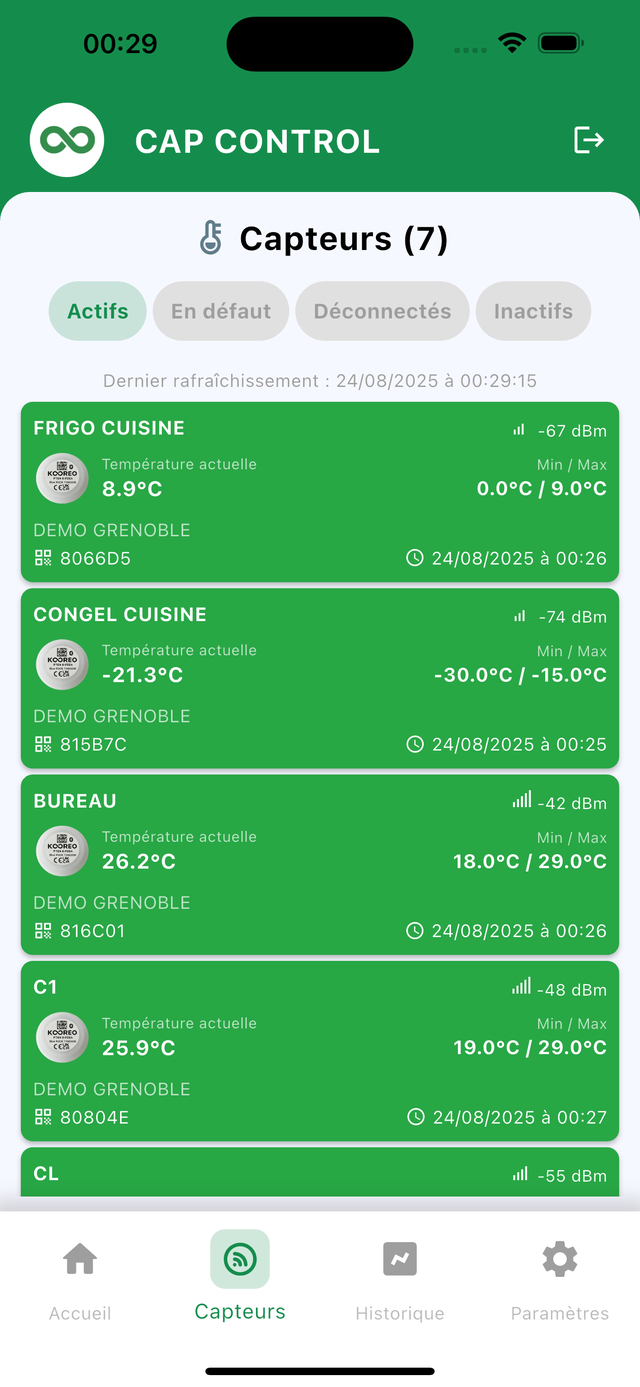
Each card shows: name, current temperature, min / max setpoints, site, serial number, signal strength (dBm) and last reading time.
Filters at the top: Active, In fault, Disconnected, Inactive.
A green card is within range. A red card is out of range.
Tap a card to open the sensor sheet.
Sensor sheet
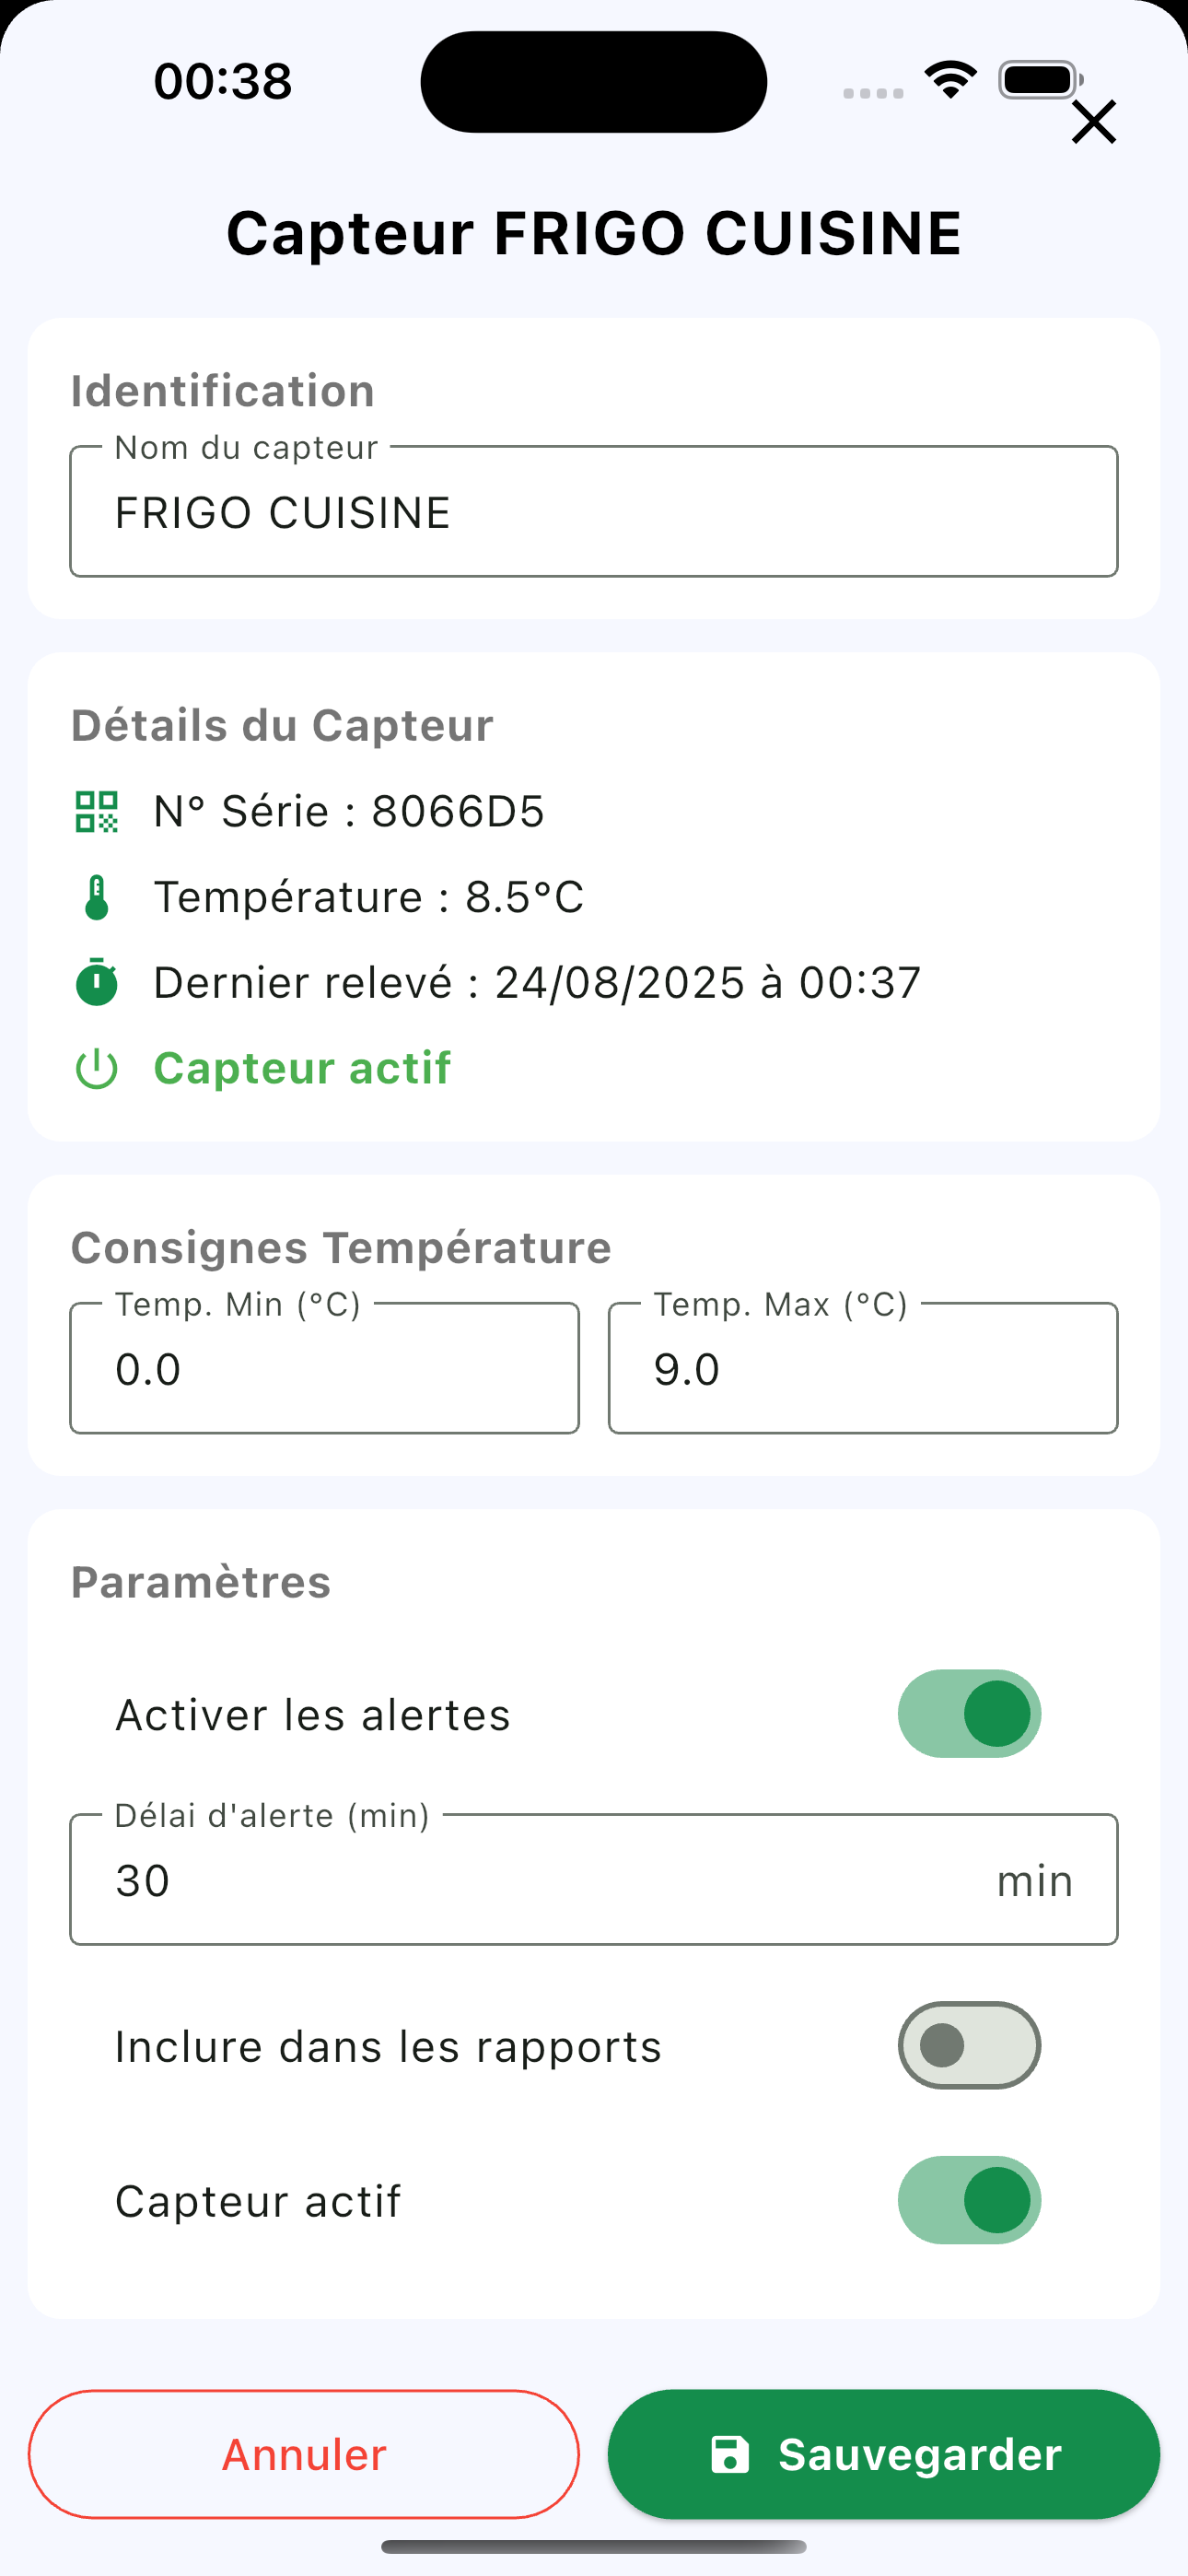
On the sheet you can:
- rename the sensor;
- read the serial number, temperature and last reading;
- set Min temp. and Max temp.;
- turn alerts on or off, set the alert delay, include the sensor in reports, and toggle Sensor active.
Cancel closes without saving. Save applies the changes.
The same thresholds can also be set on the web app. The app displays the current configuration.
History
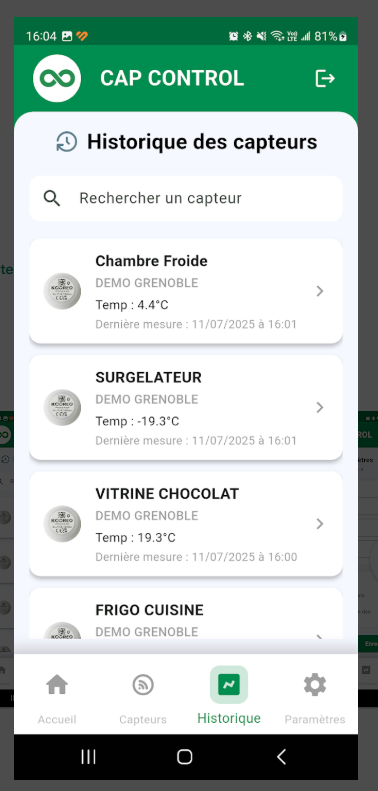
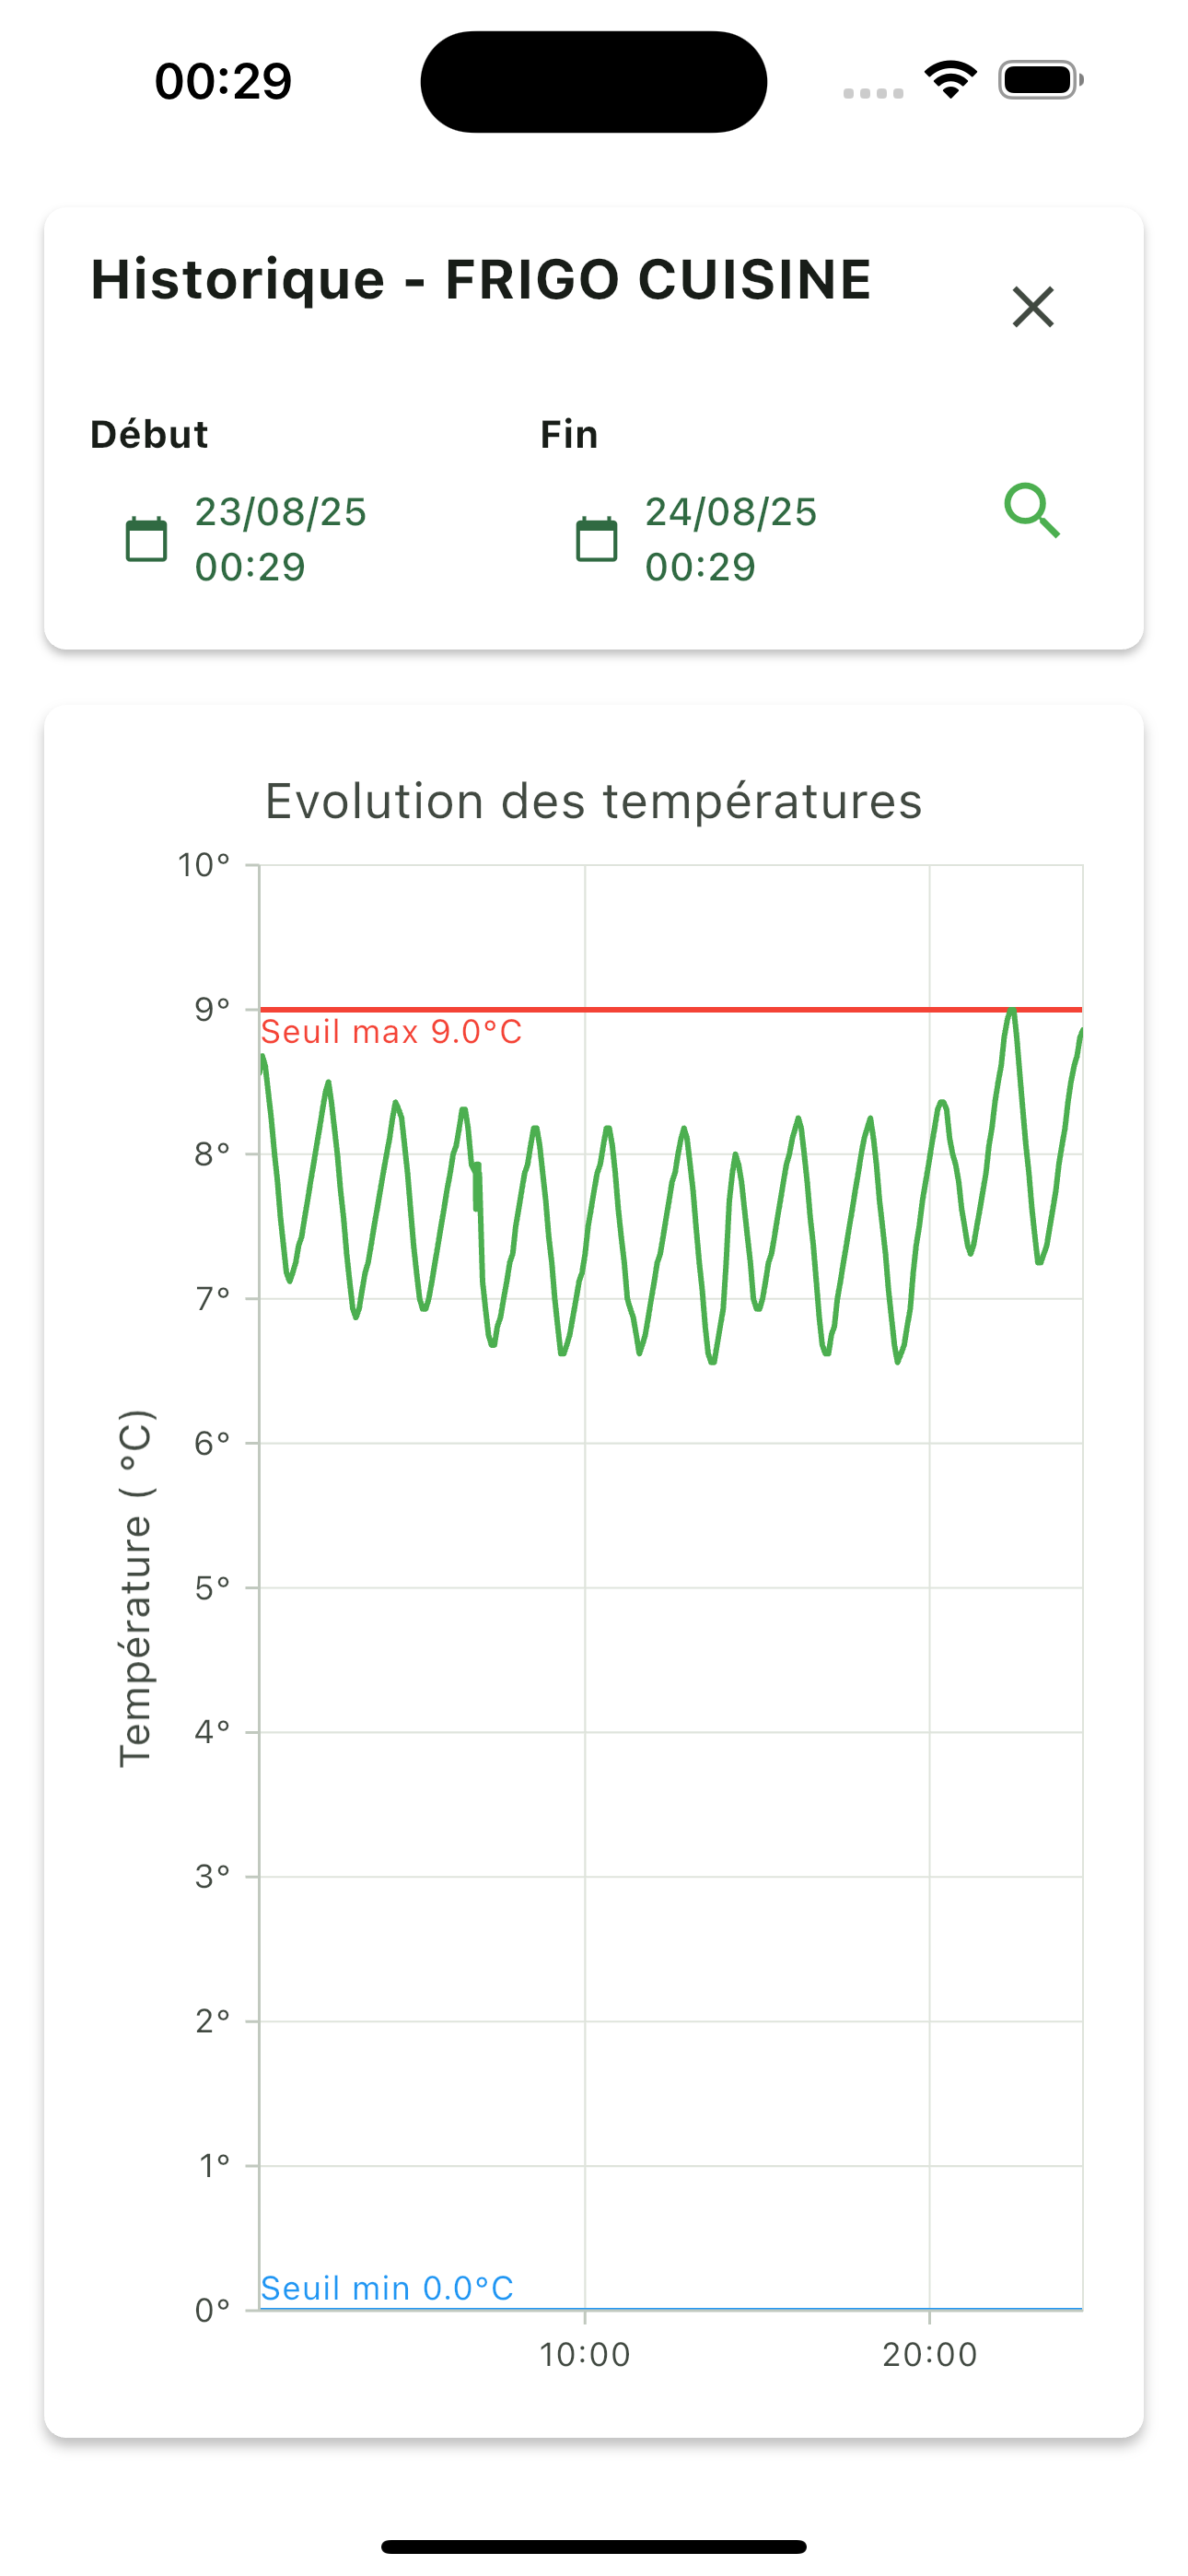
The History tab lists sensors. Use search, then tap a row.
The detail view shows the temperature chart for the selected period (start / end), with min and max threshold lines.
Offline
If a sensor has no reading, the app lists it under Disconnected. Check the gateway first (power, network), then the sensor (placement, battery).