Dashboard
Dashboard/ home screen after sign-in
Overview of your units. Indicators refresh automatically (about once a minute).
Help button (top centre) — step-by-step tour of the page
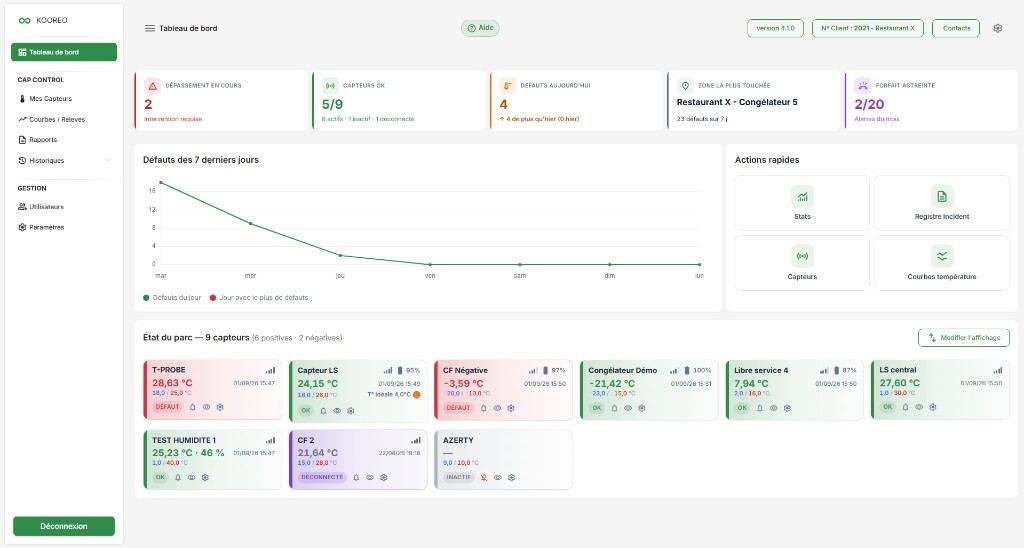
Screen landmarks
At the top: Dashboard title, green Help button, version pill, Client no., Contacts, gear icon (settings).
On the left, the KOOREO menu:
- Dashboard (active item, green background)
- CAP CONTROL section: My sensors, Charts / Readings, Reports, History
- MANAGEMENT section: Users, Settings (according to your rights)
- Log out at the bottom
Indicators
Five tiles (the 5th only appears if phone on-call is in your plan):
| Tile | What it shows |
|---|---|
| Ongoing breach (red) | Number of active alerts. Subtitle Action required, or No active breach. |
| Sensors OK (green) | e.g. 5/9, with active / inactive / disconnected. |
| Faults today (orange) | Today's volume versus yesterday. |
| Most affected zone | Unit (and site) with the most faults over 7 days. Multi-site: Most affected company. |
| On-call quota (purple) | e.g. 2/20 — Alerts this month. Can also show approaching or over quota. |
Faults over the last 7 days
Chart on the left. Legend:
- Faults of the day (green dot)
- Day with the most faults (red dot)
Useful to see whether an incident is isolated or repeating.
Quick actions
Four shortcuts on the right:
| Button | Destination |
|---|---|
| Stats | Incident statistics |
| Incident register | Alert history — if the HACCP action plan is not in the offer, the button is labelled Alerts |
| Sensors | My sensors |
| Temperature charts | Charts / Readings |
Fleet status
Title like Fleet status — 9 sensors (6 positive - 2 negative). The Edit display button is on the right (administrator).
Each card shows:
- unit name;
- temperature in large type, and humidity if the sensor measures it (e.g.
19.19 °C · 50 %); - min / max thresholds (e.g.
18.0 / 25.0 °C); - last reading (date and time);
- signal and battery;
- a status badge.
| Badge | Colour | Meaning |
|---|---|---|
| OK | green | Within thresholds, reading up to date. |
| FAULT | red | Out of range. |
| DISCONNECTED | purple | No more data. |
| INACTIVE | grey | Sensor turned off. |
Icons at the bottom of a card:
- bell: alerts for this sensor on / off (administrator: a click asks for confirmation);
- eye: opens the sensor chart;
- gear: configure the sensor (administrator).
After Edit display, drag the cards, then Save order or Reset (faults first).